The Inventory dashboard explained
The Inventory dashboard explained
Running out of a bestseller costs revenue — overbuying locks up cash. The Inventory dashboard calculates for every variant when you need to reorder, and how much. From here you select what needs ordering, place it in a purchase order, and export a ready-to-send PO per vendor — or a CSV for your own spreadsheet.
What you will learn
- Use the Inventory dashboard
- Know which products to reorder
- Read the most important statistics
Walkthrough: the Inventory dashboard explained (6:11).
Period, trend check, scope and narrow down
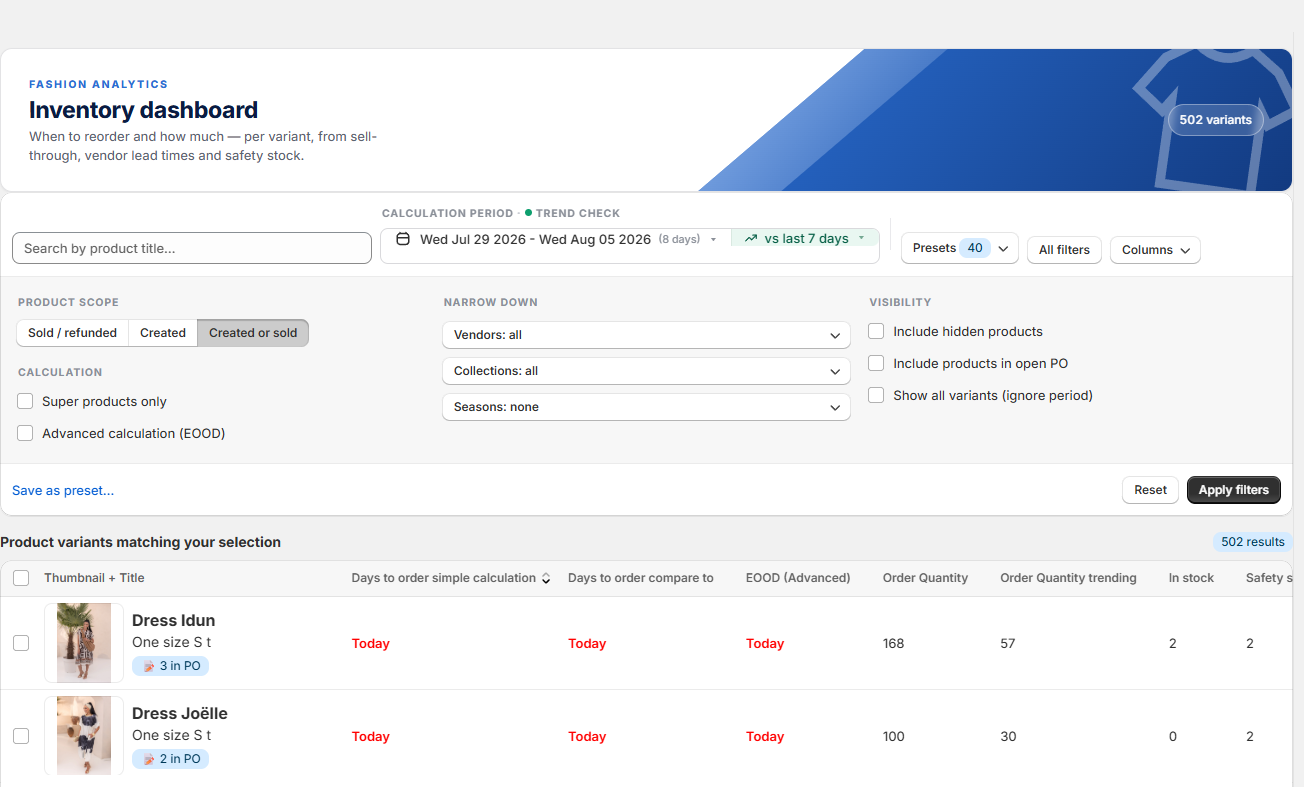
Start with the calculation period: the window the app uses to calculate your sales speed — any range works. Next to it sits the trend check: the same calculation over a second, shorter window, shown side by side; a big gap means the trend is changing. Product scope controls which products enter the list — "Created or sold" means only products created or sold during the selected period appear; "Sold / refunded" and "Created" work the same way. Under Narrow down you filter by vendor, collection or season — seasons are periods you create yourself on the Settings tab, so the range fits your shop. Two extra switches: "Super products only" narrows the list to products with above-average conversion and below-average returns (adjust those thresholds on the Settings tab), and "Advanced calculation" switches to trend-aware calculations — it needs at least one month of data.
Two optional settings: Safety stock and Growth rate
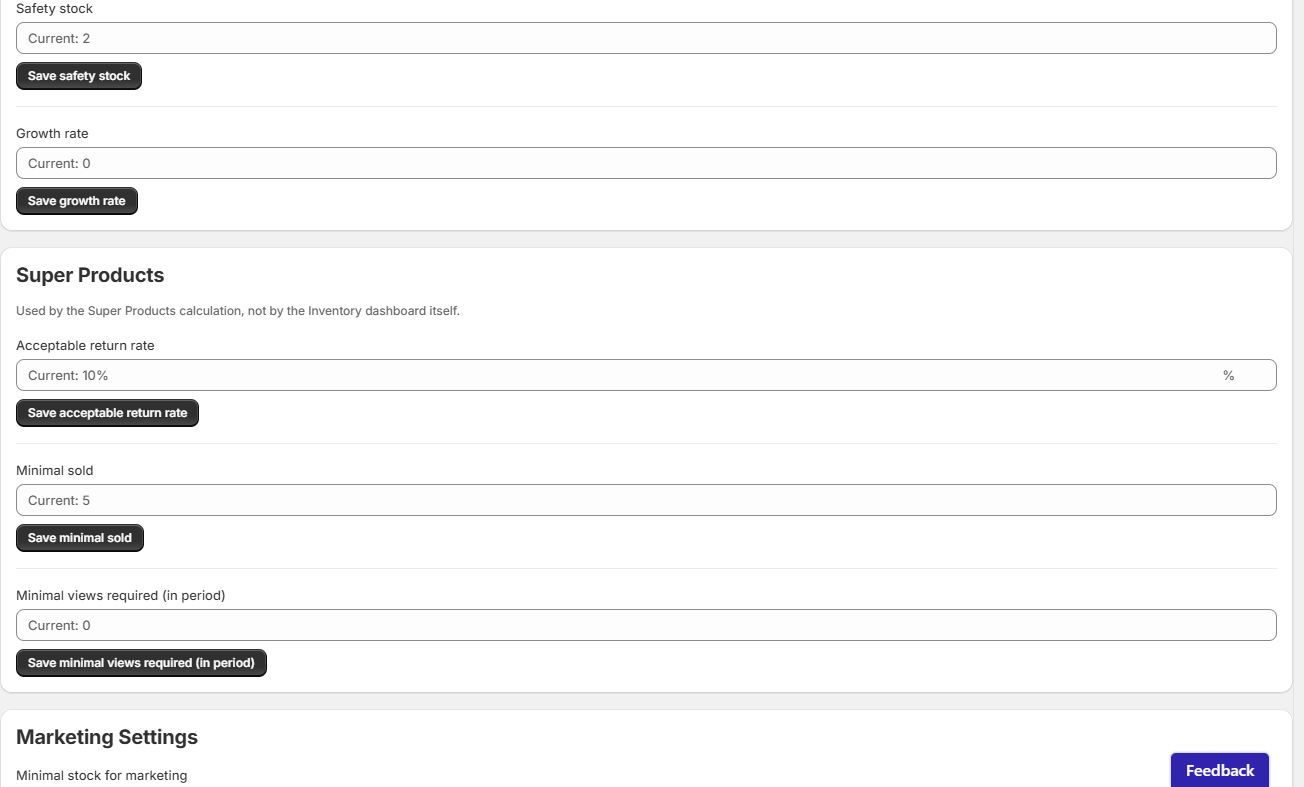
Almost everything you set for the Inventory dashboard lives on the dashboard itself — only two optional settings live on the Settings tab. Safety stock is your buffer: the order advice covers the delivery window plus this buffer, extra days of coverage so you are not sold out if the next delivery is delayed. Growth rate is for temporary, above-normal growth — say, a big sale or campaign coming up. Set a percentage and the order advice scales up. For normal growth you don't need it: the dashboard already calculates that automatically from your current sales data.
The statistics, column by column
- Days to order simple calculation — when you need to order, so this specific product doesn't run out of stock. "Today" means: order now.
- Days to order compare to — the same number over the compare window; a gap between the two means the trend is shifting. You adjust that window next to the date selection.
- EOOD (Advanced) — the estimated out-of-stock days from the advanced, trend-aware calculation — for products with irregular sales.
- Order Quantity — the number of items to order to prevent a stockout.
- Order Quantity trending — the same number recalculated on the compare window; when a product is taking off, trust the higher one.
- In stock — the current stock level.
- Safety stock — the buffer you configured.
- Items sold since start — total units sold, all-time: proof of demand over the product's lifetime.
- Items sold in period — units sold in your selected period: your current sales speed.
- Items returned since start / in period — returns, all-time and inside the selected period.
- Revenue since start / in period — the revenue from this item, all-time and in your window.
- Return Rate since start — the all-time return percentage.
- Return Rate in period — the same, inside the period. Far above the all-time rate? Then something changed recently.
- Conversion rate in period — how well the product converts inside the selected period.
- Conversion rate since start — the conversion rate since install: the stable, long-term number.
- Views in period — product-page views in the selected period.
- Days sold out — the estimated days until this product is sold out: your sale radar.
- Vendor lead time — the delivery time per vendor; you set it on the Vendor settings page.
- Unit price — the selling price, including VAT.
- Margin — the profit per unit, in your shop currency.
- Unit cost — what you pay your vendor.
- Gross Margin — the gross profit margin, as a percentage.
- Collection / Vendor — which collections the product is assigned to, and the supplier you buy it from.
Hover any statistic in the app for a short explanation — it works the same on every dashboard. Hover a product image and it enlarges, so you can see exactly which product you are looking at.
Pick your columns, save your preset
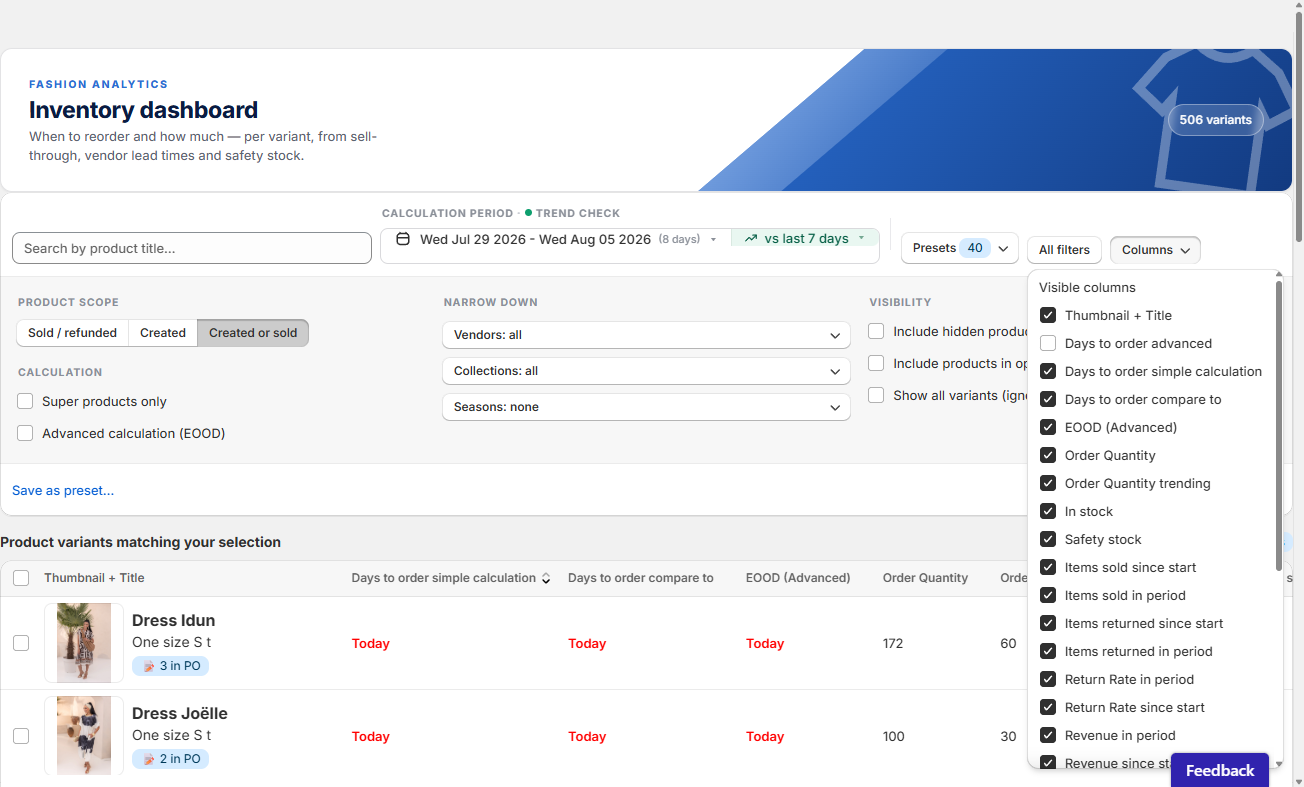
Which columns you see is up to you. Open the Columns dropdown and switch statistics on or off. Save your combination with "Save as preset" — it is stored for next time, handy when you only want to see your most important statistics. Your saved presets live in the Presets dropdown at the top.
Turn the advice into a purchase order
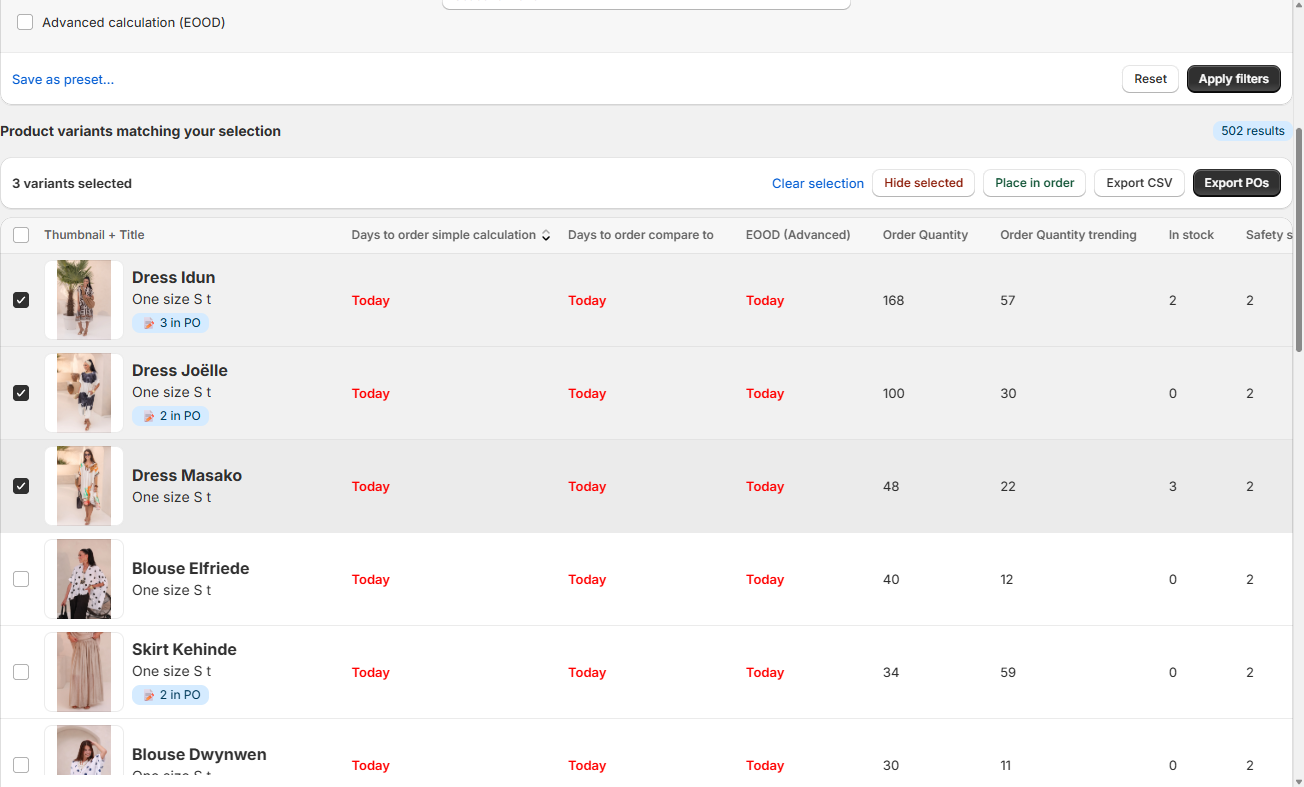
Select the variants you want to buy and click Place in order: they are marked as in an open purchase order, with their order quantity. Export POs is a different function — it creates the purchase-order record and downloads a ready-to-send PDF per vendor, using the contact details from Vendor settings. Export CSV downloads the selection as a spreadsheet for your own analysis. Hide selected removes items from the list, until you bring them back with the "Include hidden products" option.
💡 Good to know
- The order advice covers the delivery window plus your safety stock — set vendor lead times once on the Vendor settings page and the advice adapts per vendor.
- Only use Growth rate for temporary spikes like a sale or campaign — normal growth is already in the calculation.
- For your weekly routine, see the tutorial "How to do your weekly reorder run".
Never run out. Never overbuy.
The Inventory dashboard tells you when and how much to reorder, the statistics prove it, and Place in order plus Export POs turn it into a real order — a ready-to-send PDF per vendor.
Still have questions about the Inventory dashboard?
We're happy to help you get more out of it.
✉ Email us support@fashion-analytics.com