The Marketing dashboard explained
The Marketing dashboard explained
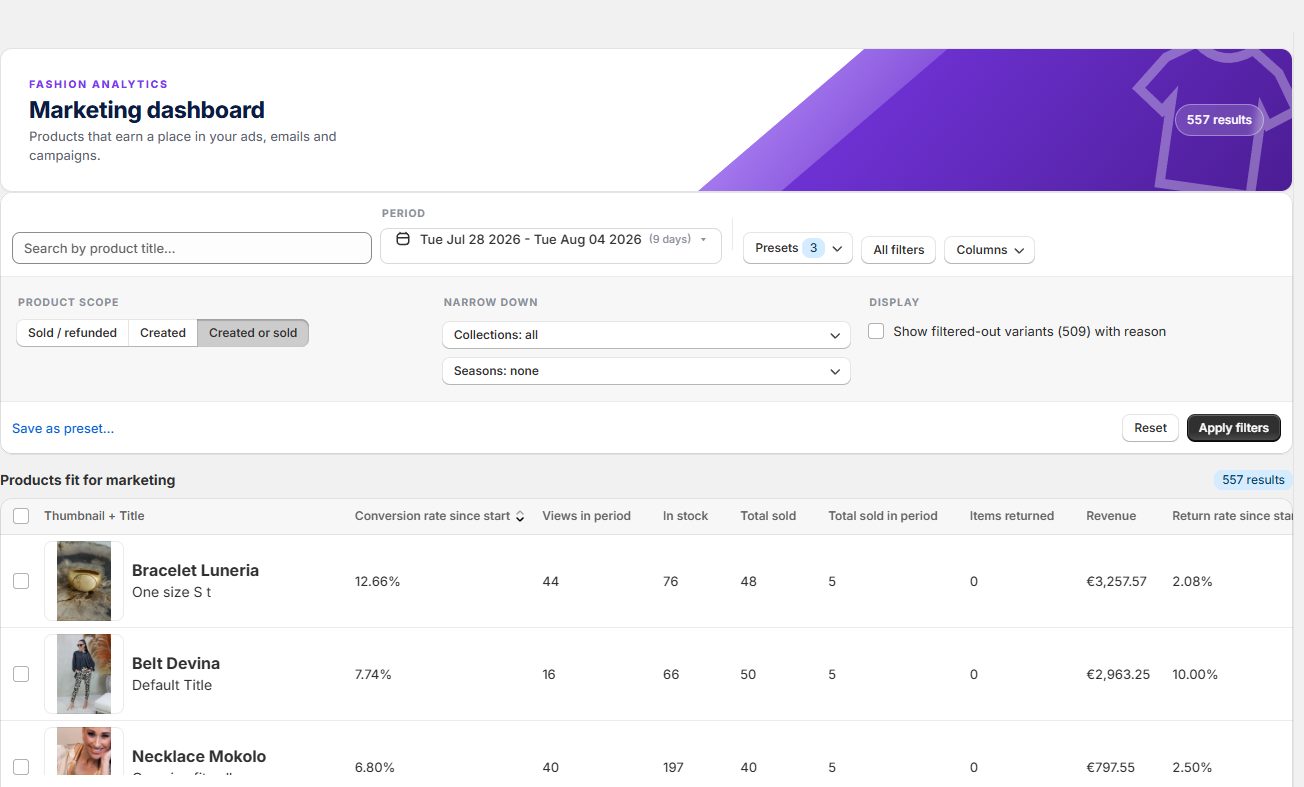
Not every product deserves ad money or marketing promotion. The Marketing dashboard lists the ones that earn a place in your ads, emails and campaigns: here you find your very best products, push them to your Shopify site with a Shopify tag — and via that tag to channels like Klaviyo and third-party marketing software, so they land in Meta Ads, Google Ads and more. You can also export any selection as CSV or PDF.
What you will learn
- Find the items for your marketing campaigns
- Use the settings for this dashboard
- Read the most important statistics
Walkthrough: the Marketing dashboard explained (3:23).
Period, scope and narrow down
Start with the period: any date range works, or pick one of your own seasons from the Settings page. Product scope controls which products enter the list — "Created or sold" means only products that were created or sold during the selected period appear; "Sold / refunded" and "Created" work the same way for just sales or just new products. Under Narrow down you filter by collection or season.
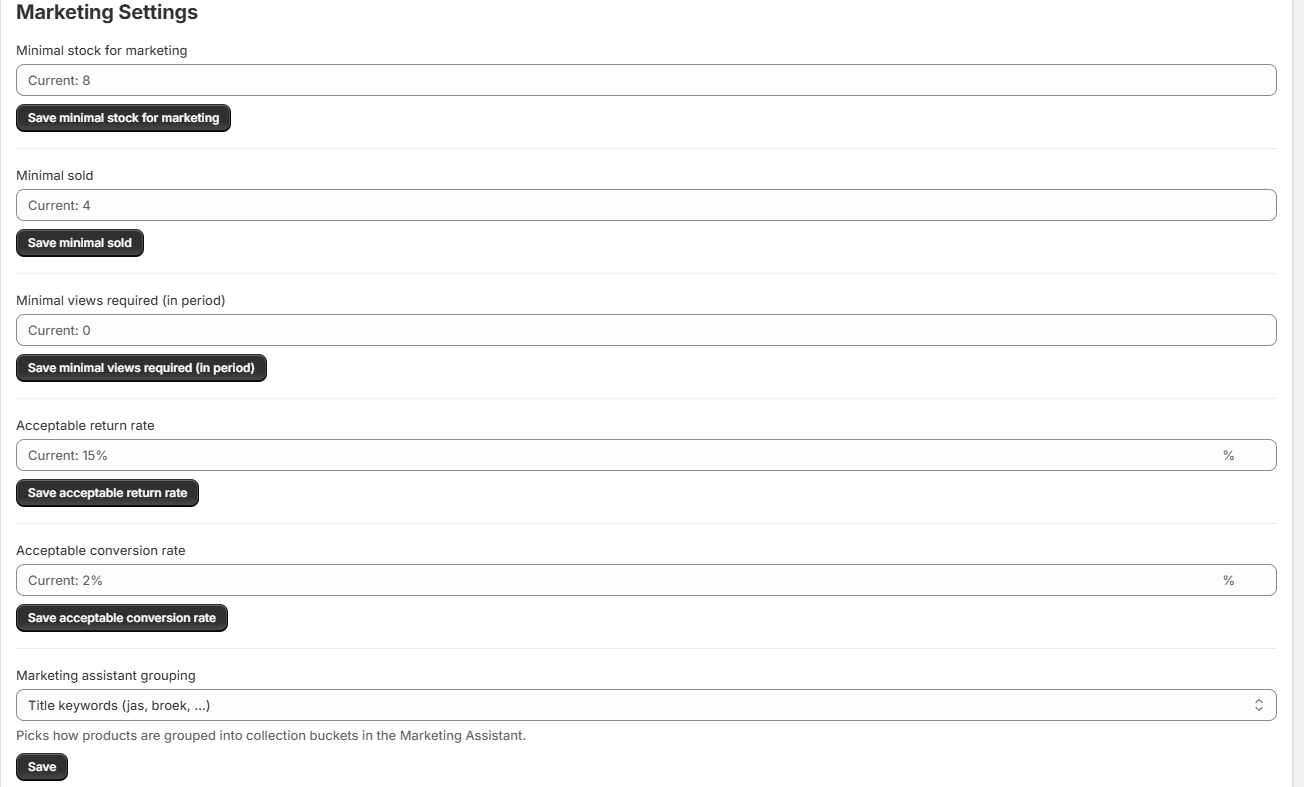
The Marketing Settings decide who gets in
By default the list only shows products that fit the Marketing Settings you entered on the Settings tab. Minimal stock for marketing: only products with at least that many units in stock — so campaigns only push products you can deliver. Minimal sold: only products that sold more often than this number — more sales means more stable, more accurate conversion data. Minimal views required does the same for product-page views in the period. Acceptable return rate: only products with a return rate below your number — it filters the bad products out. Acceptable conversion rate: only products converting above your number — that's how you find your very best products. Tick "Show filtered-out variants" on the dashboard to also see what those settings stopped, each with a badge naming the reason.
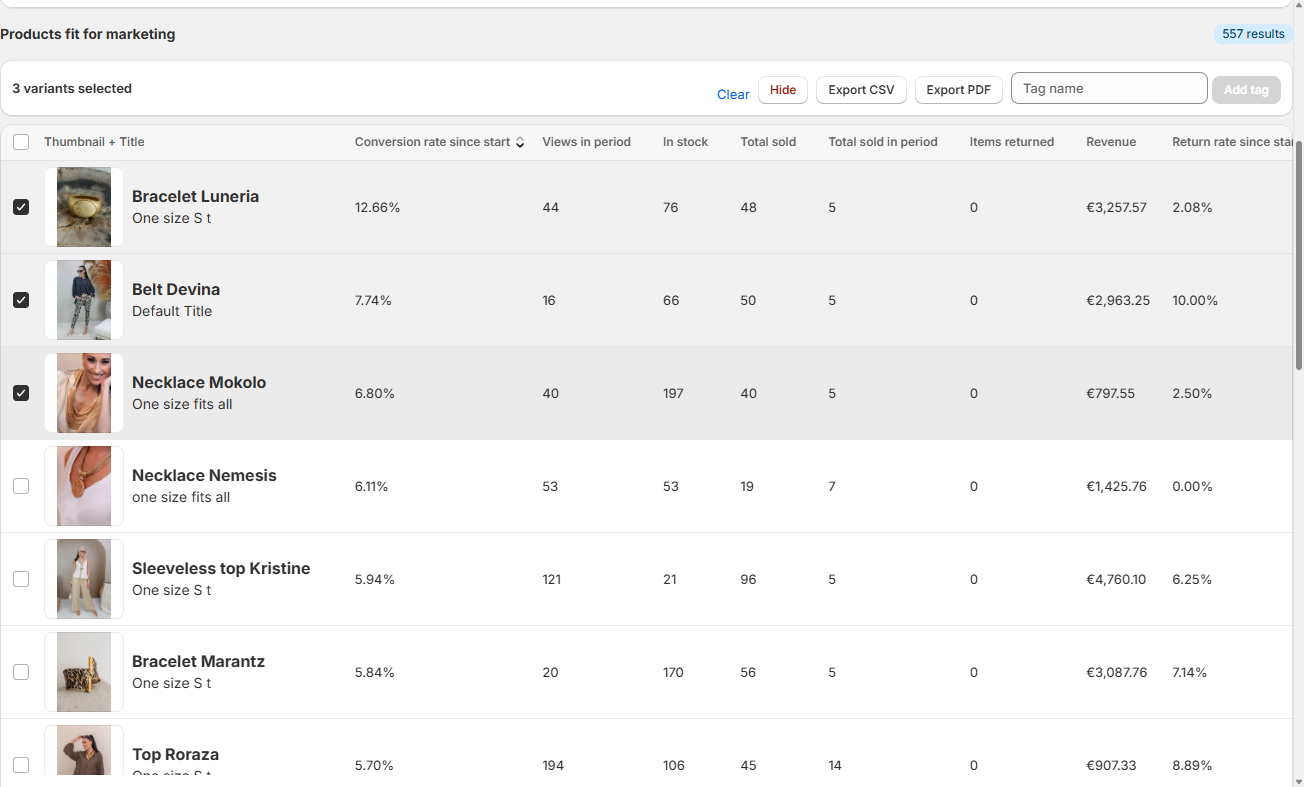
The statistics, column by column
- Conversion rate since start — how well a product converts, since install.
- Views in period — product-page traffic in the selected period.
- In stock — current stock level; never promote what you can't deliver.
- Total sold / Total sold in period — demand, all-time and in your window.
- Items returned — returns in the selected period.
- Revenue — total revenue.
- Return rate since start — the all-time return percentage.
Hover any statistic in the app for a short explanation — it works the same on every dashboard.
Put it to work: tag, export, or hide
Select the products you want to push. Type a tag name and click Add tag: the Shopify tag is written to your store, and your emails, flows and ad tooling pick it up from there. Export CSV downloads the selection as a spreadsheet for your own analysis; Export PDF makes a shareable overview for your team or agency. Hide removes items from this dashboard until you put them back manually from the hidden products / variants tab.
💡 Good to know
- Only proven products earn your ad money — the statistics prove it, a tag or export puts them to work.
- The Marketing assistant builds ready-made selections (like Hidden gems) on top of this dashboard.
One dashboard between your data and your campaigns
The Marketing dashboard shows which products deserve your marketing money, the statistics prove it, and a tag or export puts the selection to work — in your store, your email flows and your ad campaigns.
Still have questions about the Marketing dashboard?
We're happy to help you get more out of it.
✉ Email us support@fashion-analytics.com