The Settings explained
The Settings explained
Every dashboard has its own settings, and most of them can be found right on the dashboard itself. But a few important ones deserve a place of their own: your seasons, the numbers behind every calculation, and the thresholds that define your winners. This is where they live — set them once, check them now and then.
What you will learn
- Set up seasons that fit your shop
- Tune the numbers behind every calculation
- Use the most important settings in the app
Walkthrough: the Settings explained (2:36).
Seasons that fit your shop — not someone else's calendar
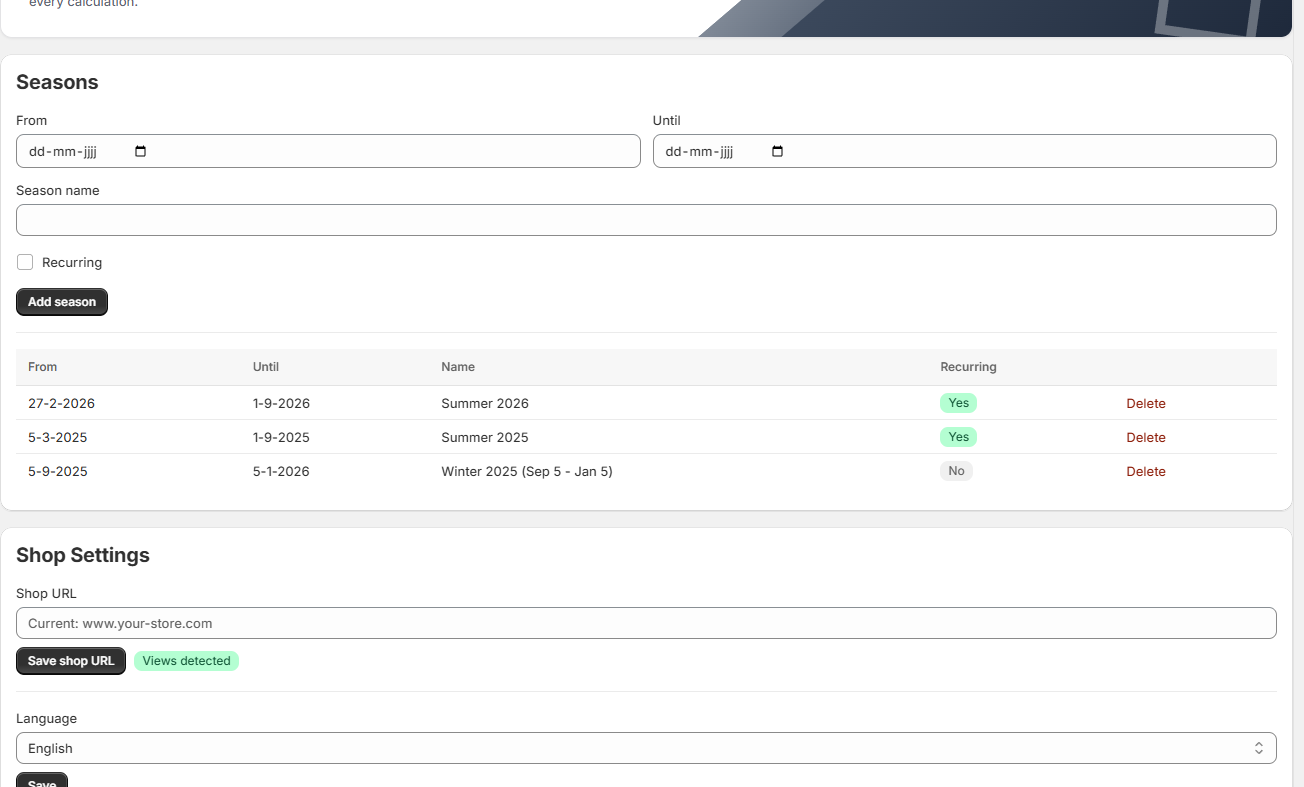
Most inventory apps lock you into fixed seasons. Fashion Analytics lets you create your own: a start and end date, and a name — so they fit your shop perfectly. Tick Recurring to repeat a season every year. From then on, every dashboard lets you pick a season as its period: perfect for year-over-year comparisons and pre-buying decisions.
Safety stock and growth rate: the buffer behind every reorder
Safety stock adds extra days of coverage on top of the lead time — so you're not sold out if the next delivery is delayed. Growth rate is only for temporary, above-normal growth, like a big sale: normal growth is picked up automatically from your sales data.
Super Products: define your proven winners
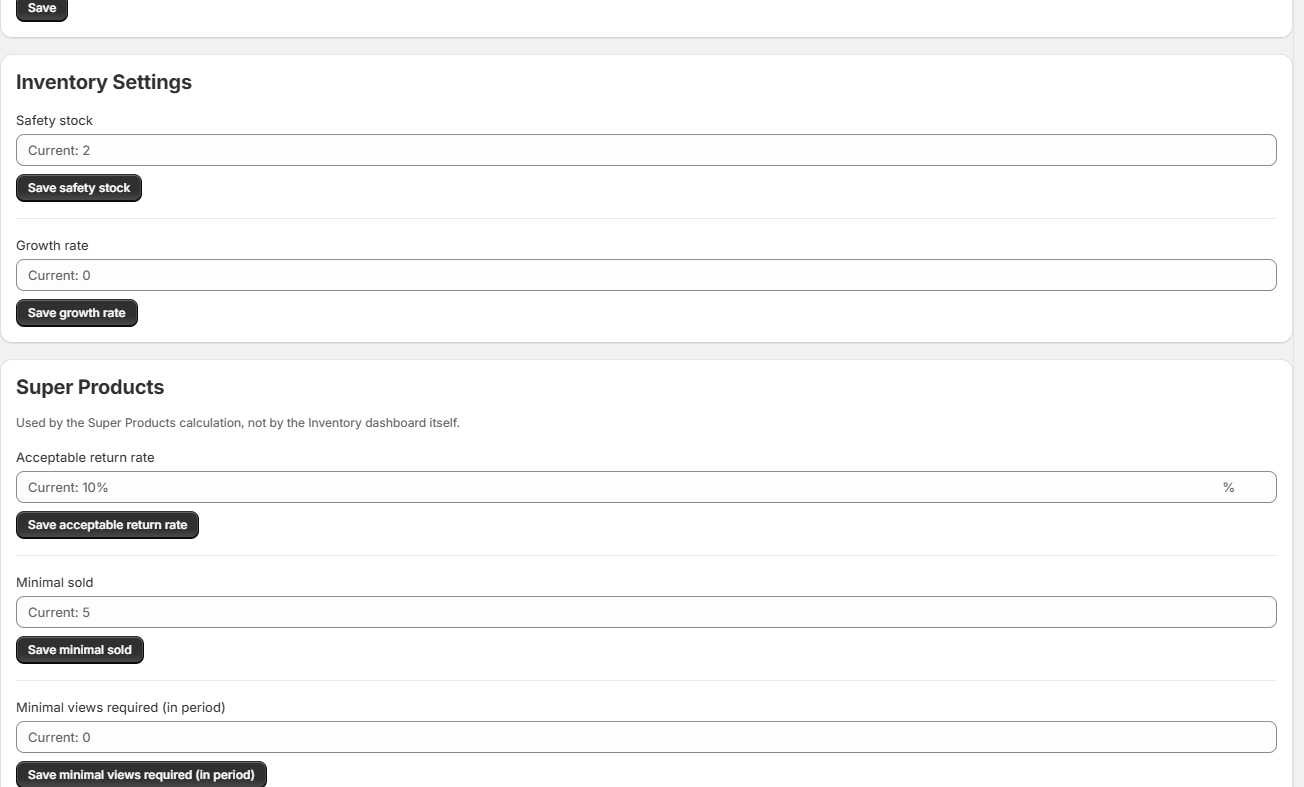
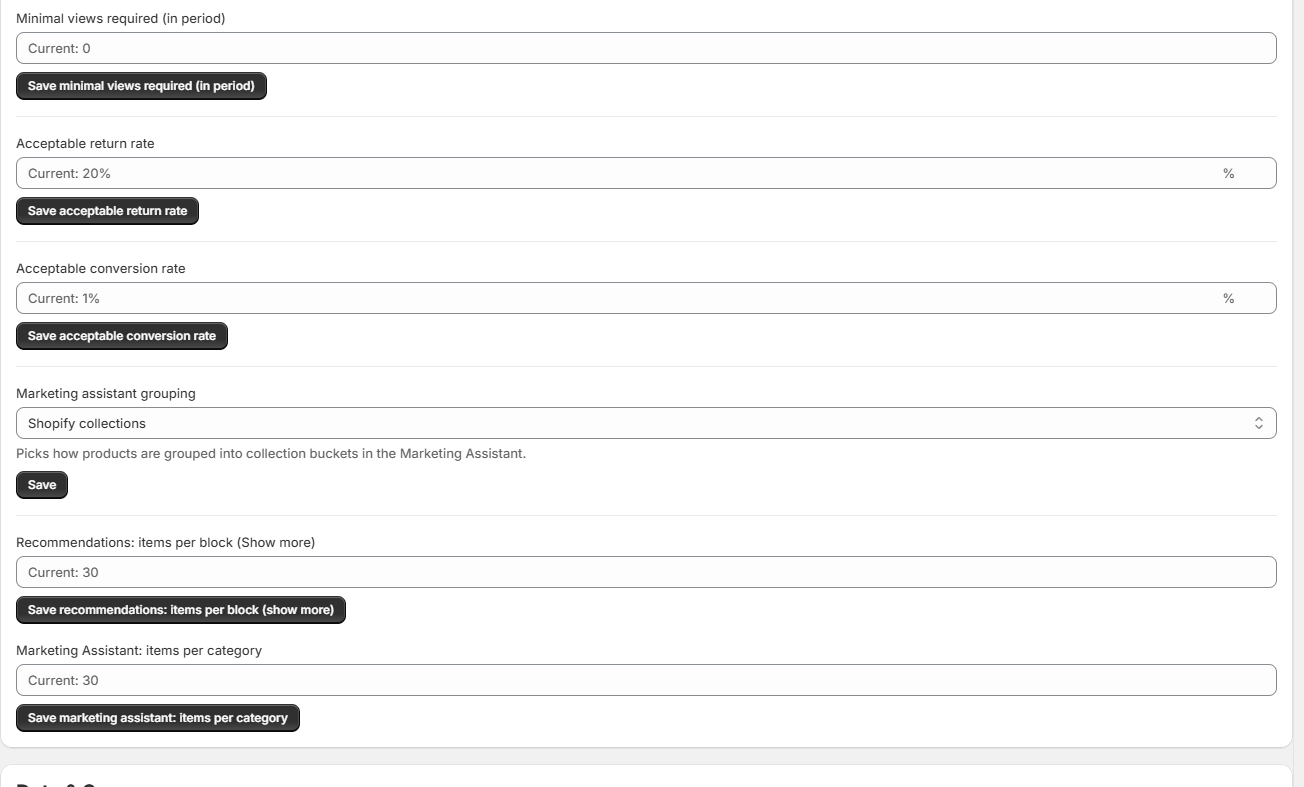
Super Products are your proven winners: products that convert above your shop average, with low returns. You find them on the Inventory dashboard with the Super products only filter. Here you set the thresholds they must meet — acceptable return rate, minimal sold and minimal views. Conversion is checked automatically: it must beat your shop's live average.
Marketing Settings: who earns a place in your campaigns
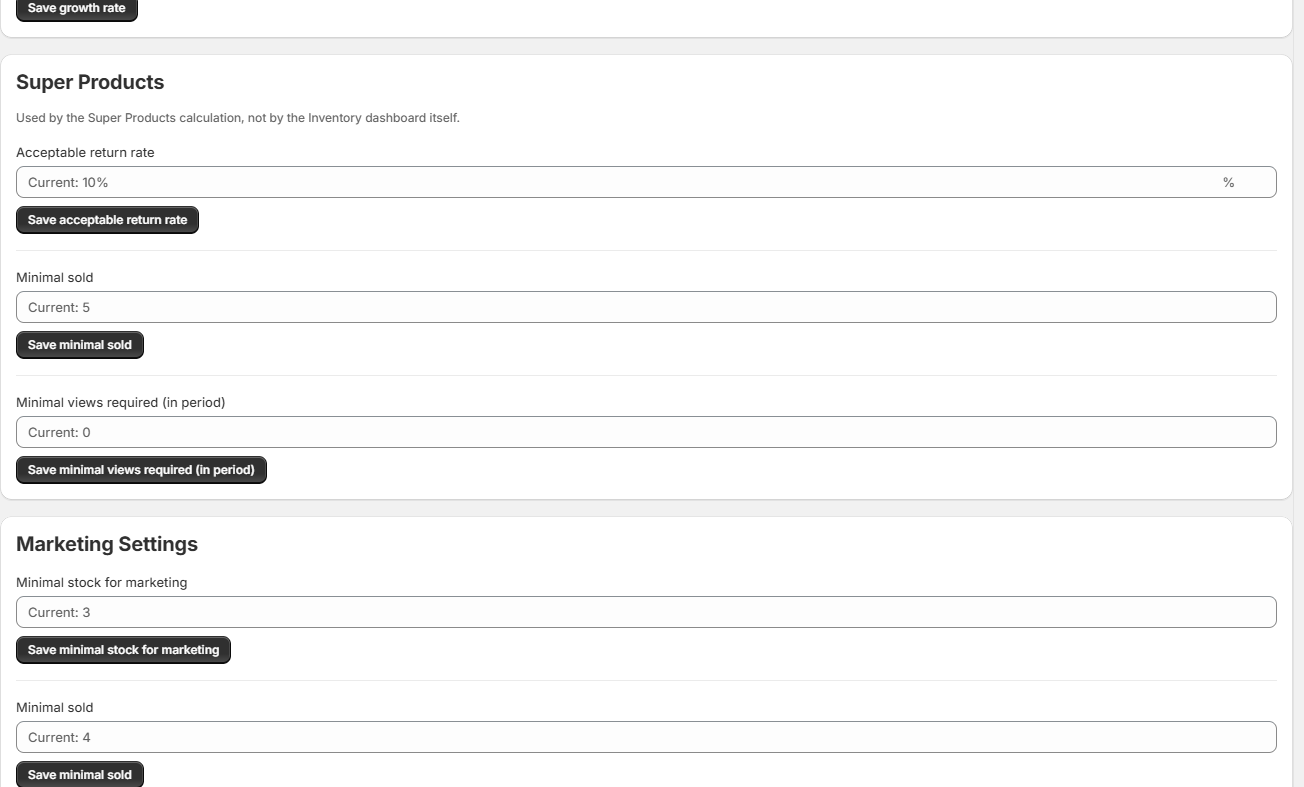
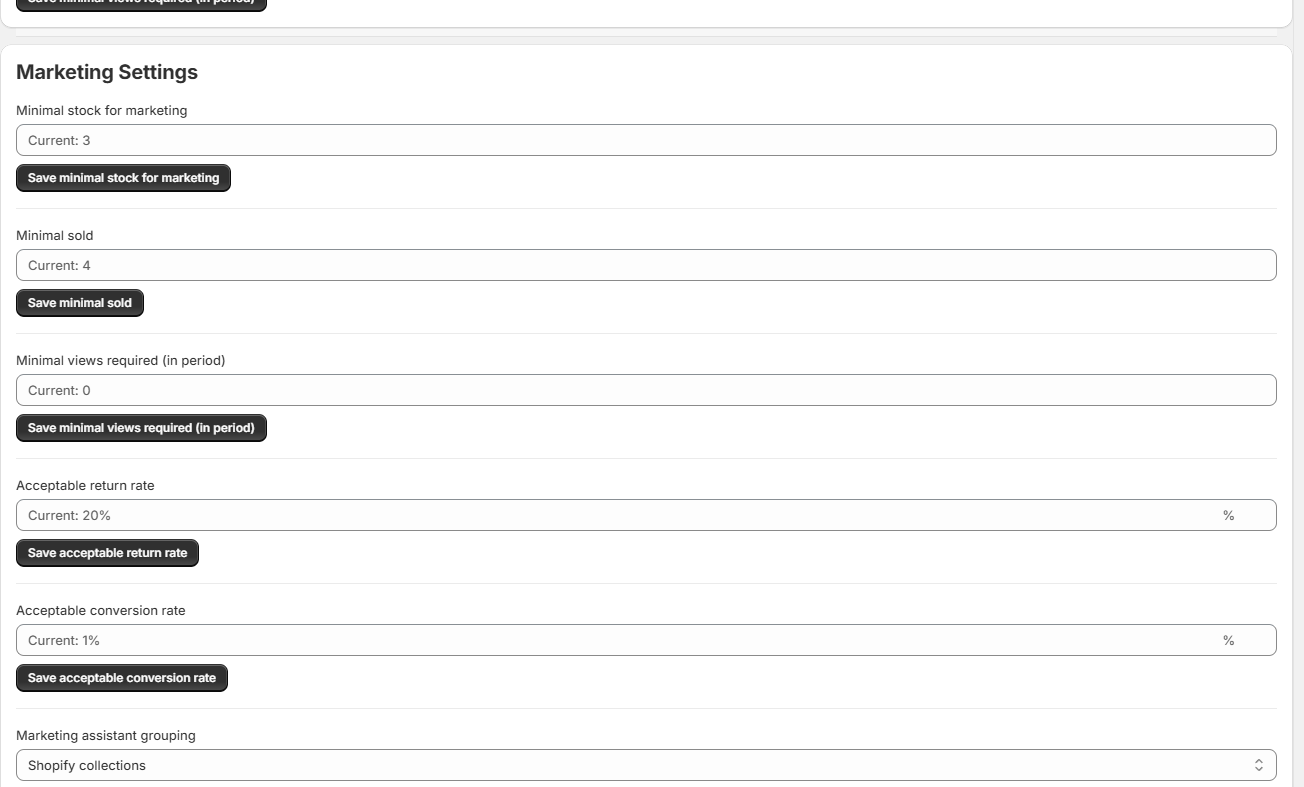
The five marketing thresholds decide which products appear on the Marketing dashboard — minimal stock, minimal sold, minimal views, acceptable return rate and acceptable conversion rate. Each of them is explained in detail in the Marketing dashboard tutorial.
Grouping and sizing for the assistant and Recommendations
Marketing assistant grouping decides how the assistant groups its campaign selections — by Shopify collections, title keywords, Shopify tags, or AI-detected categories. Recommendations: items per block (Show more) controls how many results the Recommendations page shows, and Marketing Assistant: items per category does the same for each assistant block.
The Claude AI connector: ask your shop anything
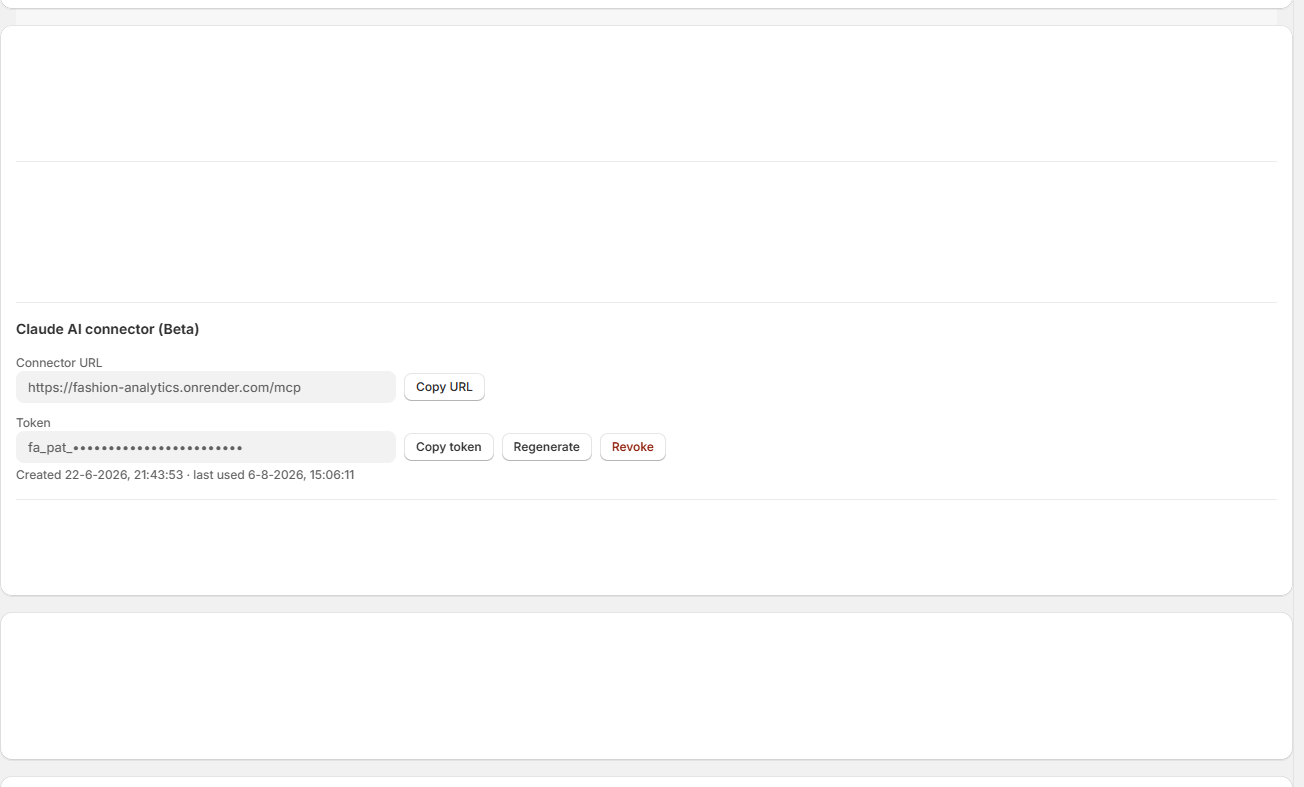
With a personal token you can ask questions about your shop data straight from Claude — "what should I reorder this week?" in plain language. Treat that token like a password: anyone with it can read your shop's inventory and PO data. Setting up the connector has its own tutorial: How to connect your key store data to other apps with AI connectors.
💡 Good to know
- Create your buying seasons once — every year-over-year question afterwards is two clicks.
- Raising safety stock makes you safer but ties up capital; tune it per how risky a stock-out is for you.
- Check the thresholds after your first weeks of data: your shop average moves, and so should they.
Set once, check now and then — every advice fits your shop.
A handful of settings drive every calculation in the app. Set them once, and every dashboard speaks your shop's language.
Still have questions about the Settings?
We're happy to help you get more out of them.
✉ Email us support@fashion-analytics.com